Our Research
Our research is centred around humans with a unique focus on 'interaction' with an aim to develop and/or study applications that can solve real-world problems. With the two technological pillars of intelligent learning and software, we develop a range of industrial applications and study their impacts on user experience and task performance. Human-centredness means humans are not just users of a technological solution; they are a central part of the solution. In human-centred AI, human intelligence and artificial intelligence are seamlessly integrated to provide a solution that outperforms each one alone. Human-centred SE particularly considers the human aspects of SE such as culture, personality, collaboration, interaction and experience, as majority of software is developed by humans to be used by other humans. In some cases, AI and SE need to be integrated so that the developed software allows a human to partner with an AI agent. This page shows some examples of our research.
Human-centred AI
Context-aware Explainable Human-AI Interaction
This project is sponsored by Defence Industry & Innovation's Next Generation Technologies Fund to develop a collaborative human-centred AI (CHAI) system for submarine control room console operators and study its impact on the decision making performance in a high risk, time critical environment. The system provides a dedicated CHAI assistant for each type of operator that is tailored to the specific context of each operator's task and types/sources of data to be processed in order to reduce the number of dimensions of information each console operator has to process at any given moment and assist their analysis and decision.
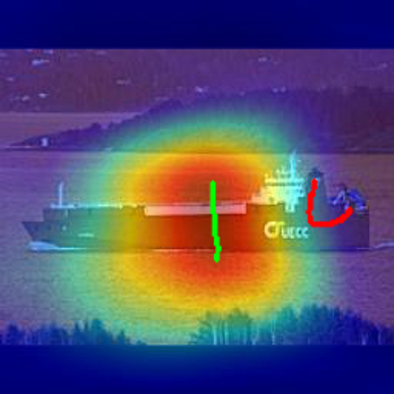
The core technical innovation of a CHAI assistant is its underpinning context-aware explainable human-AI interaction (CAXHAII) technique to support interactive sensemaking that is processing and displaying the relevant context information surrounding a specific console task. There are two perspectives of interactive sensemaking. One is human sensemaking of AI's automation through task-specific and context-aware AI explainability. The other is AI sensemaking of human's expertise through human-in-the-loop interaction. Interactive sensemaking with human and AI partnering with and complementing each other has the potential to achieve decision superiority, which will be demonstrated by evaluating the reduction of cognitive load of human operators and the improvement of human decision-making performance. For the task of image classification, in our case of Periscope, CNN attention heatmaps can be generated from the last network layers to provide an explanation on where CNN is 'looking at' to make its decision. The image above displays a wrongly classified carrier ship with a predicted class of 'Cargo'. Intuitively, the attention on the middle part of the vessel seems to be wrong as it does not contain discriminative features. Through CAXHAII, human operator can annotate the incorrect attention map (the explanation) using scribbles (green as 'remove attention' and red as 'add attention') and then feedback to CNN for fine-tuning or retraining.
Human-AI Interactive and Continuous Sensemaking
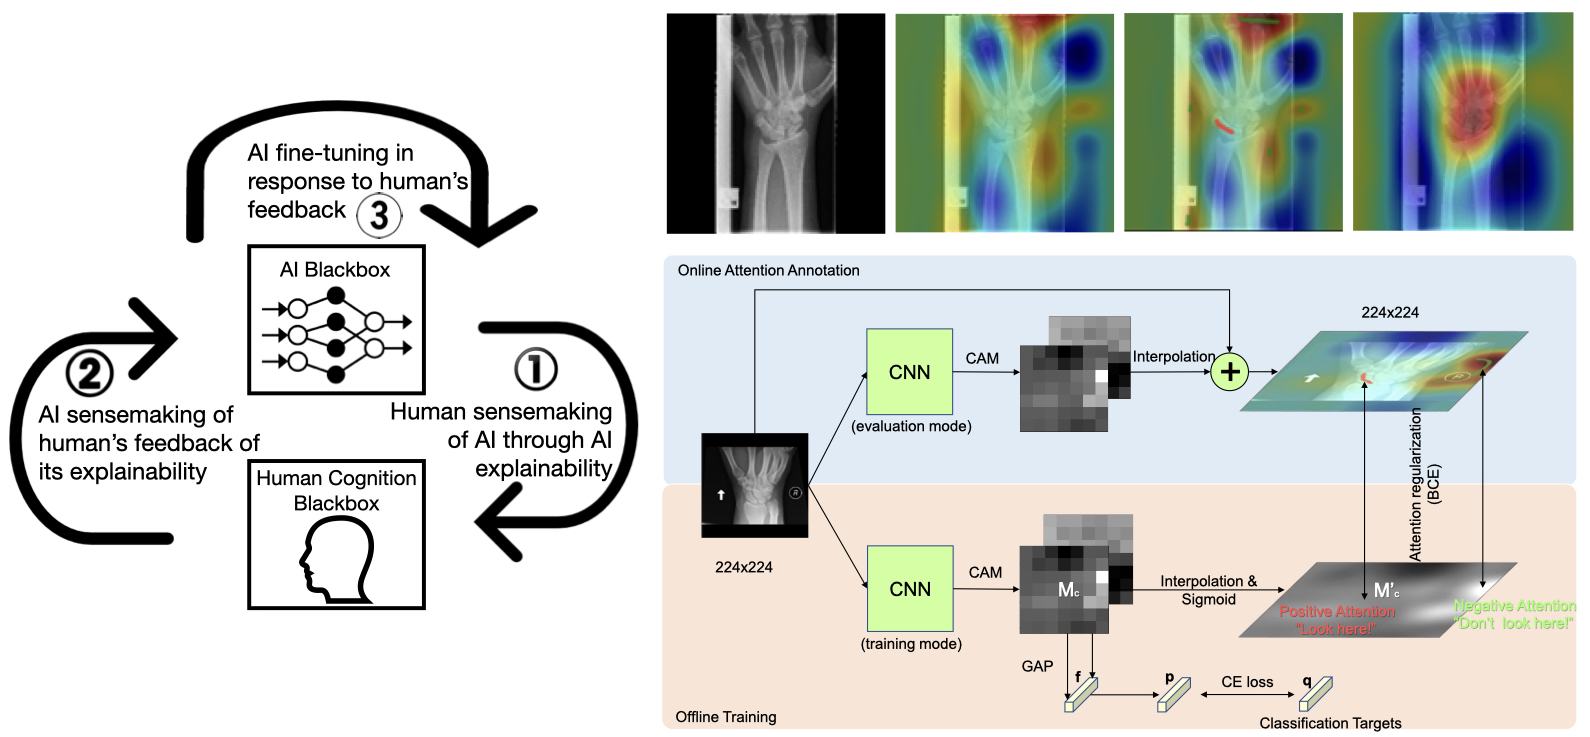
A common criticism of AI techniques especially deep learning models is the blackbox nature of their learning and reasoning process as they do not provide reasoning rationale for their output to humans. This has a detrimental effect on humans’ trust in the decisions made by AI based systems. Explainable AI is to open up the blackbox to elucidate the reasoning processes of AI algorithms in such a way that makes sense to humans. Just like human trying to make sense of AI through its explanation so that AI’s decisions can be trusted, AI also needs to makes sense of human’s feedback on its explanation so that it can learn from human’s expertise. Effective human-AI interaction requires unveiling both black boxes to each other for mutual sensemaking. If AI’s explanation makes sense to the human and the human is able to point out incorrect reasoning in such a way that makes sense to AI, AI would be able to fine tune itself for performance improvement.
We propose a conceptual framework, known as human-AI interactive and continuous sensemaking, or HAICS, for supporting effective human-AI interaction. It consists of three iterative processes that start with human sensemaking of AI through AI's explanation, then proceed with AI sensemaking of human's feedback on its explanation, and end up with AI fine-tuning its model for performance improvement based on human's feedback. Human sensemaking of CNN is through heatmap-based attention visualization. How does the AI know whether the human agrees or disagrees that the CNN classifier has accurately localized the interested objects in an attention map ? This is through human feedback in the form of annotation scribbles, in the form of: 1) a positive attention mark in red color indicating the image region that the network attention should be at, and 2) a negative attention mark in green indicating the image region that should be ignored by the network, which are then recorded for fine-tuning of the inspected network.
Human-centred SE
Real-time Morale Visualisation
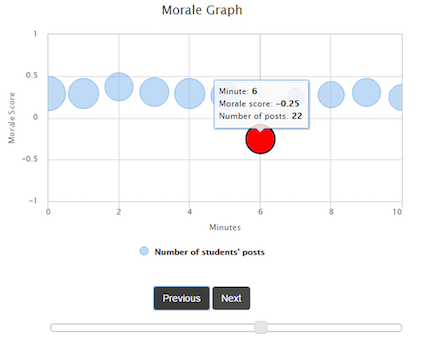
This work explores a proof-of-concept method for analysing the emotions and sentiments from the audience's feedback in real time and displaying to the presenter a morale graph based user interface showing a trend of the audience's overall reaction over time. This allows a presenter to be effectively connected to their audience in real time, knowing whether their presentation is going well and what issues their audience may have in common at any specific moment. We have further implemented this method in an educational context, using a prototype backchannel system, known as ClasSense, for a lecturer to effectively connect to their students. We have also evaluated the system, which shows that lecturers accept and prefer the morale graph based user interface developed over other backchannel user interfaces that display all posts in chronological order. Students also positively expressed their agreement that the system not only makes their feedback an important part of the class but also increases their interactions with the lecturers.
The significance of this research is its demonstration of effectiveness in a live in-lecture and online teaching and learning environment. However, the tool's features are not restricted to this format. The general applicability of the tool lends itself to many other types of contexts. For example, it is not difficult to conceptualise this same tool being used to capture audience sentiment in a conference setting or other types of collaborative online environments. Similarly, the implications for its use in different environments is transferable – the ability to respond to the information provided by the tool to address issues as they arise. Thus, the tool can be used to improve delivery performance and confidence that the audience’s expectations and interests are being met in many contexts.
Context-aware Visualisation as a Service
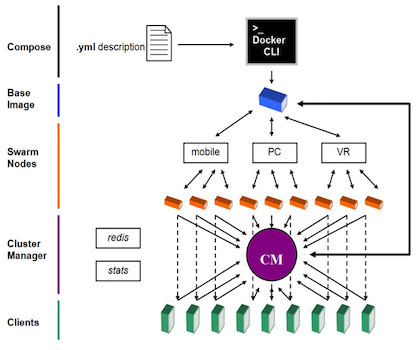
This project was sponsored by Defence Industry & Innovation's Next Generation Technologies Fund to develop a framework and a concept demonstrator showing the feasibility of running high-end graphics-intensive visualisations across multiple platforms ranging from wall displays to mobile phones through CaaS (Containers as a Service) whereby cloud computing service providers can offer container-based virtualisation as a scalable online service to a range of clients that do not require high-end graphic devices. CaaS enables the users to develop, test, execute or distribute the software in the application containers and use the container services without the need to have their own high-end infrastructure. An important benefit of CaaS is that it simplifies the process of deploying applications in the cloud.
In addition to making it easier to deploy applications in the cloud, a core reason for adopting CaaS is to increase both portability and adaptability of the applications. Visualisation applications are usually resource intensive and often require specific hardware and software to run. With CaaS, visualisation applications can be deployed in the cloud that provides the specific hardware and software resources required. A variety of devices using only a Virtual Network Client (VNC) can then access the full features of these applications. Furthermore, the visualisation applications become context-aware – different containerised visualisation applications can be custom-created to service the clients' devices, such as smartphone, tablet, PC, Head-Mounted Display (HMD), dataglove, or data wall among other devices. On top of portability and adaptability, the visualisation applications can take full advantage of the cloud computing resources such as high-performance computing services (HPC) and GPU clusters. These resources can be exploited to parallel process machine learning algorithms and accelerate the graphics rendering pipeline that the visualisation applications require before passing the desktop or app to a myriad of remote devices. Implementation of this architecture using Docker containerisation provides a flexible, scalable, and secure approach that can be coupled with nVidia's CUDA kernel to improve overall performance through graphics acceleration and GPU-enabled parallel processing.
Integration of AI and SE
Predictive CI/CD
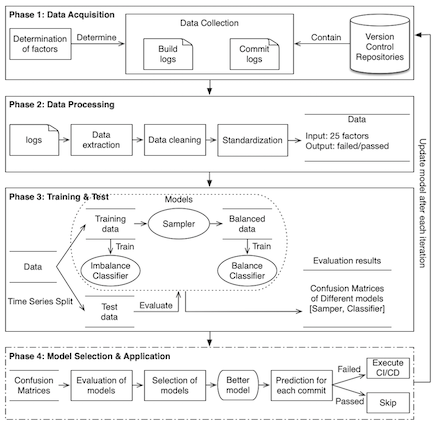
Continuous Integration (CI) enables developers to detect defects in a timely manner so as to shorten the lead time. It has gradually been recognized as one of the most important software development practices in the industry. However, the high frequency and long duration of builds in the CI process have become the bottleneck of this practice. Predictive CI is to forecast the result of the current build using a model trained with a set of features pertaining to the context of the build. Builds predicted to pass can be skipped, and the code will be merged directly into shared mainline code repository. This method can potentially improve efficiency by reducing the number of CI script executions while maintaining the same number of test cases in the CI script. In other words, the quality standard of each build is retained at the expense of reduced number of builds.
Machine Learning (ML) has been widely used as a powerful tool to support Software Engineering (SE). The fundamental assumptions of data characteristics required for specific ML methods have to be carefully considered prior to their applications in SE. Within the context of Continuous Integration (CI) and Continuous Deployment (CD) practices, there are two vital characteristics of data prone to be violated in SE research. First, the logs generated during CI/CD for training are imbalanced data, which is contrary to the principles of common balanced classifiers; second, these logs are also time-series data, which violates the assumption of cross-validation. This project systematically studied the two data characteristics and further provide a comprehensive evaluation for predictive CI/CD with the data from real projects. We evaluated 67 CI/CD predictive models using both cross-validation and time-series-validation. Our evaluation shows that cross-validation makes the evaluation of the models optimistic in most cases, however there are a few counter-examples as well. The performance of the top 10 imbalanced models are better than the balanced models in the predictions of failed builds, even for balanced data. The degree of data imbalance has a negative impact on prediction performance.
Point-of-Care Quantitative Urinalysis
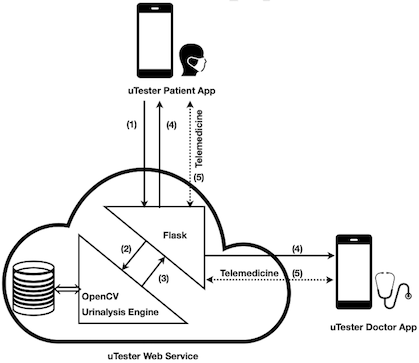
This research was to design and develop a smartphone-based urinalysis device, known as uTester, that has the ability for chronic kidney disease (CKD) patients themselves to conduct rapid and reliable quantitative diagnosis of albumin in urine using their own smartphones. The key contribution of this work is a novel solution to the device agnosticism issue as a wide diversity of smartphones co-exist in the market. The solution comprises: a) custom-design and fabrication of an imaging housing that provides a consistent imaging condition regardless of the physical dimensions and the camera position of the smartphone used, b) orchestration of an image processing and machine learning based analysis process that produces consistent image colour intensity values regardless of the camera sensor and image software used by the smartphone, and c) special design and development of an intuitive cross-platform mobile application that is scalable to growth, adaptable to changes, resilient to loss of data, and has an extremely low requirement for smartphone hardware.
The final design is a hybrid thin mobile client - uTester Patient App - that is connected to a uTester Web Service provisioned by a cloud through Infrastructure as a Service (IaaS). The Patient App has two main functions of urinalysis and telemedicine. This design has a number of advantages. First, the native mobile client is simple, easy to develop, and does not require much hardware resource. Second, the urinalysis application is adaptable to changes as new image processing and analysis techniques and more accurate urinalysis prediction models can be adopted without the need to update the native mobile client. Third, the urinalysis application is scalable with the growing number of images and test results. Last, the urinalysis application is resilient to the loss or replacement of smartphone as all the test images and results are securely stored in the cloud. An alternative design would be a fat native mobile application into which all the processing is built and all the data is stored, making it extremely heavyweight, inflexible and vulnerable to device agnosticism.